近几十年来,全球大部分地区的海洋表面温度急剧变暖,这表明赤道太平洋西部变暖的速度快于东部(“拉尼娜式”变暖)。它不同于现有讨论厄尔尼诺引起的遥相关对全球变暖的响应研究中所使用数值模式模拟的“类厄尔尼诺”变暖。一些研究表明,厄尔尼诺遥相关对海洋表面变暖模态敏感,但其机制仍然难以捉摸。本研究使用再分析数据和数值试验,研究冬季厄尔尼诺大气遥相关如何响应历史海洋表面变暖模态。结果表明,厄尔尼诺抑制大西洋-非洲-印度洋区域的沃克环流影响北非冬季气候,而在海洋表面变暖的情况下这种抑制作用减弱了,这与观测到的变化相匹配。同时,试验再现了观察到的厄尔尼诺现象引起的太平洋-北美波的减弱及其下游传播在海洋表面变暖情景中被抑制的现象,这主要是因为涡旋拉伸对厄尔尼诺现象引起的副热带急流中波源的贡献减少了。本研究结果证明了海洋表面变暖模式在厄尔尼诺现象引起的大气遥相关预测中的重要作用。
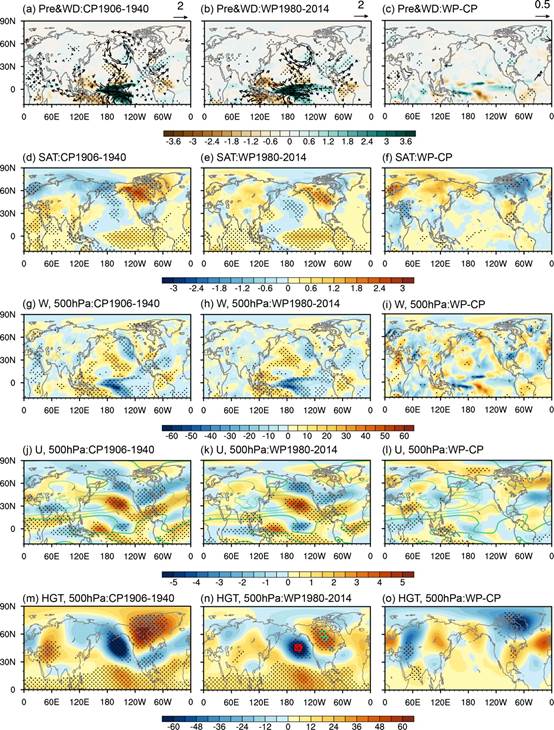
图 1. Composite differences for precipitation (color; mm day-1) and horizontal winds at 850 hPa (m s-1; vectors) in El Niño winters during (a) 1906–40 and (b) 1980–2014, and (c) the difference between 1980–2014 and 1906–40, using the reanalysis dataset. (d)–(f) As in (a)–(c), but for surface air temperature (color; 8C). (g)–(i) As in (a)–(c), but for the vertical velocity at 500 hPa (color; m s21). (j)–(l) As in (a)–(c), but for zonal wind at 500 hPa (color; m s21); green lines in (j)–(l) show the mean zonal wind (contour interval 5 10) during 1901–2014, the thick line denotes zero line, and the solid line denotes positive values. (m)–(o) As in (a)–(c), but for geopotential height at 500 hPa (color; m); squares in (n) show the centers of maximum (green) and minimum (red) in 1906–40, and triangles in (n) show the centers of maximum (green) and minimum (red) in 1980–2014. Stippling and vectors illustrate where differences are statistically significant at the 90% confidence level, using a two-tailed Student’s t test.
Reference:
Hao, X., H. Wang, B. Zhou, J. Li, J. Wei, and T. Han, 2023: Ocean Surface Warming Pattern Inhibits El Niño–Induced Atmospheric Teleconnections. J. Climate, 36, 1521–1539.