国际顶级学术期刊Science子刊Science Advances(《科学·进展》)以Research Article的形式在线发表了题为“Aerosol-forced multidecadal variations across all ocean basins in models and observations since 1920”的最新研究成果。该工作是由中心研究人员与美国纽约州立大学戴爱国教授共同完成。
地球气候存在十年至数十年的年代际周期变化,给我们的社会和环境造成巨大影响。气候系统的年代际波动通常是由自然内部变率引起的,许多研究将其与北大西洋年代际振荡(AMO)和太平洋年代际振荡(PDO/IPO)相关联。最新的研究表明,自1920年以来,火山和人为气溶胶的变化可以引起同相、多年代际的全球海温变化。这些外强迫的变化规律与AMO类似。在北大西洋,气溶胶通过对太阳辐射的直接和间接作用影响了海温的年代际变化。而在热带太平洋,大气环流对气溶胶强迫的响应起着重要作用。此项成果首次揭示出了气溶胶强迫全球洋盆的多年代际变化。

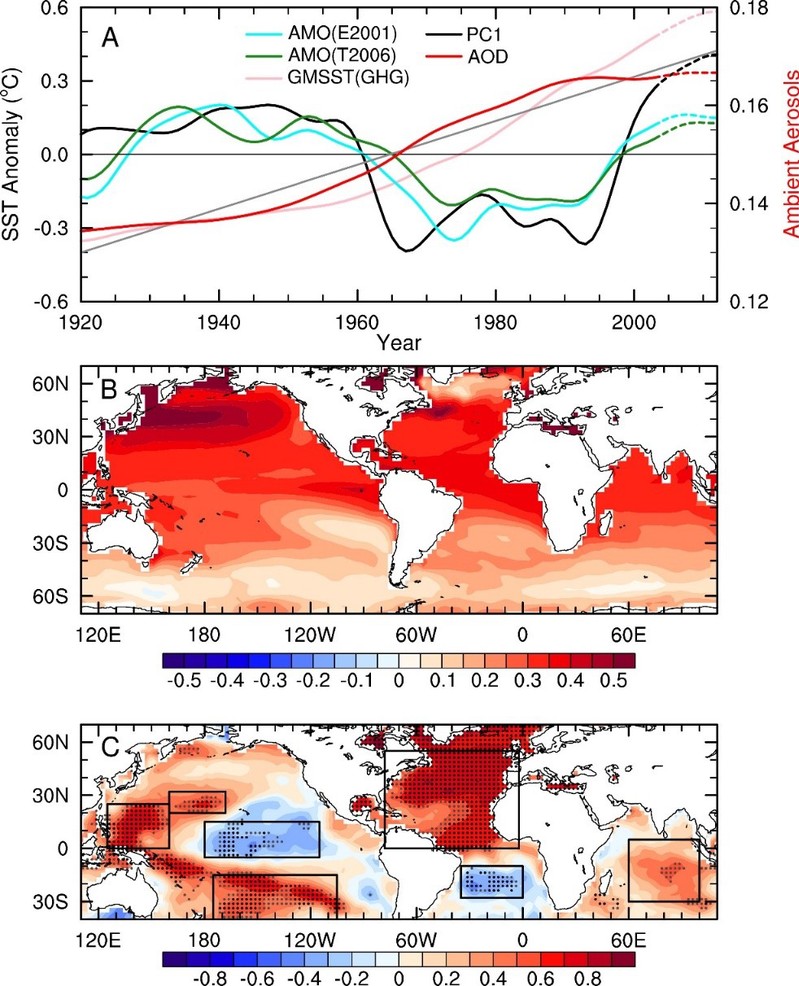
Fig. 1. In-phase, multidecadal SST variations across all ocean basins in observations and models. (A) Temporal (black line) and (B) spatial patterns of the leading EOF (92% variance) in global (60°S–60°N) low-pass filtered SST fields from CMIP5 MMM of all-forcing simulations from 1920-2012 after the GHG-induced warming (pink line) being removed through linear regression. Also shown in A are: the smoothed tropospheric aerosol optical depth (AOD) averaged over the oceans (red, grey=trend), linearly-detrended annual-mean SST anomalies averaged over the North Atlantic (80°W–0°W, 0°–60°N) as in (18) (blue) and annual SST anomalies averaged over the North Atlantic after removing the global-mean SST as in (19) (green). (C) Correlation between the black line in A and local low-pass filtered SST anomalies from observations during 1920-2012 after removing the GHG-induced warming through regression. The black (grey) stippling indicates statistically significant correlations at the 0.05 (0.1) level based on a Student's t-test considering autocorrelation. The data near the right end in A (marked by dashed lines and excluded in the calculation for C) were derived with mirrored data in the filtering. Results are similar using 13-year moving averages. The outlined boxes in C are analyzed further below.
与此同时,地球科学领域的顶级期刊《Geophysical Research Letters》也在线发表了题为“Quantifying contributions of internal variability and external forcing to Atlantic multidecadal variability since 1870”的研究论文,后续报道了有关内部自然变率和人为活动影响大西洋多年代际变率(AMV)的物理机制。该工作也是由我中心师生与美国纽约州立大学合作完成。
确定AMV的物理机制对于理解和预测年代际气候变化至关重要。但是,AMV背后的原因仍在争论中。一个关键问题是内部变率和外部强迫在引起AMV中的相对贡献。人们认为,AMV是由大西洋环流及其与大气的相互作用造成的,但正在进行的辩论是,诸如气溶胶年代际变化等外部强迫是否在最近北大西洋海温的年代际变化中发挥了重要作用。研究发现,尽管自1870年以来AMV主要是由自然变率导致,但气溶胶强迫的年代际变化恰好与内部变率引起的AMV处于同相状态,使得AMV的变化幅度增大。我们的新发现不仅调和了有关内部变率和外部强迫在引起AMV中作用的争议,而且还为以下观点提供了令人信服的新证据:最近的AMV是由内部变率和气溶胶年代际变化共同导致的。
以上研究工作得到了国家重点研发计划项目(2016YFA0600702)、中美国家自然科学基金(42075022、AGS-2015780)等的支持。

Fig. 2. Aerosol-induced multidecadal variations in NASST. (a) The epoch-mean of the SST anomalies (ºC) during four AMO phase periods from CMIP5 MMM of single forcing (i.e., NAT, VA, SI and AA) simulations. The multi-model ensemble average is shown by the black dots. The box plots show the distribution of SST anomalies, with the inside line for the median, the box for the 25th and 75th percentile range, and the whiskers for the maximum and minimum values. The bright purple box indicates the epoch-mean during 1902-1914 with strong volcanic eruptions. The bright yellow box denotes the epoch-mean of SST anomalies during 1996-2012 with AA-forcing model simulations, which extend to 2012. We calculated the SST anomalies from each single forcing simulation with its linear trend from 1870-2005 removed. (b) The Northern Hemispheric mean of stratospheric aerosol optical depth (AOD) at 550 nm as implemented in CMIP5 model simulations for 1870-2012 (black line with blue shading). The light blue line represents the smoothed ambient aerosol optical depth (AOD) at λ = 550 nm averaged over the North Atlantic from the CMIP5 AA-forcing MMM from 1870-2005 with its linear trend (dashed line). The annual-mean total solar irradiance (TSI, W/m2, red line) from 1870-2005. Horizontal red lines indicate the epoch-mean of the TSI.
文章列表:
Qin Minhua, Dai Aiguo, Hua Wenjian. 2020. Aerosol-forced multidecadal variations across all ocean basins in models and observations since 1920. Science Advances, 6(29), eabb0425.https://10.1126/sciadv.abb0425
Qin Minhua, Dai Aiguo, Hua Wenjian. 2020. Quantifying contributions of internal variability and external forcing to Atlantic multidecadal variability since 1870. Geophysical Research Letters, https://doi.org/10.1029/2020GL089504
